Natural Emission
Global high-resolution natural emissions
Data Status:
Published
Publication State:
20 May 2020
Introduction
Natural emissions of air pollutants from the surface play major roles in air quality and climate change. In particular, nitrogen oxides (NOx) emitted from soils contribute ~15% of global NOx emissions, sea salt aerosols are a major player in the climate and chemistry of the marine atmosphere, and biogenic emissions of volatile organic compounds (VOCs) are the dominant source of VOCs at the global scale.
We use Harvard-NASA Emissions Component (HEMCO; http://wiki.seas.harvard.edu/geos-chem/index.php/HEMCO) to produce hourly global emissions of soil NOx, SSAs, and BVOCs at different resolutions.
These emissions are calculated at 0.5° lat. x 0.625° lon. for 1980—2017 using MERRA-2 assimilated meteorology and at three resolutions (0.25° lat. x 0.3125° lon., 2° lat. x 2.5° lon., and 4° lat. x 5° lon.) for 2014—2017 using GEOS-FP.
Our long-term high-resolution emission datasets offer useful information to study natural pollution sources and their impacts on air quality, climate, and carbon cycle.

Table 1. Global annual total emissions of soil NOx, SSAs, and BVOCs (with standard deviation) over 1980–2017 derived based on MERRA-2 at 0.5° lat. × 0.625° lon.
We also offer the respective emissions at lower resolutions, which can be used to evaluate the impacts of resolution on estimated global and regional emissions.

Table 2. Global annual total emissions of soil NOx, SSAs, and BVOCs over 2014–2017 derived based on GEOS-FP at three resolutions. The percentage values represent the relative changes from emissions at 4° lat. × 5° lon.
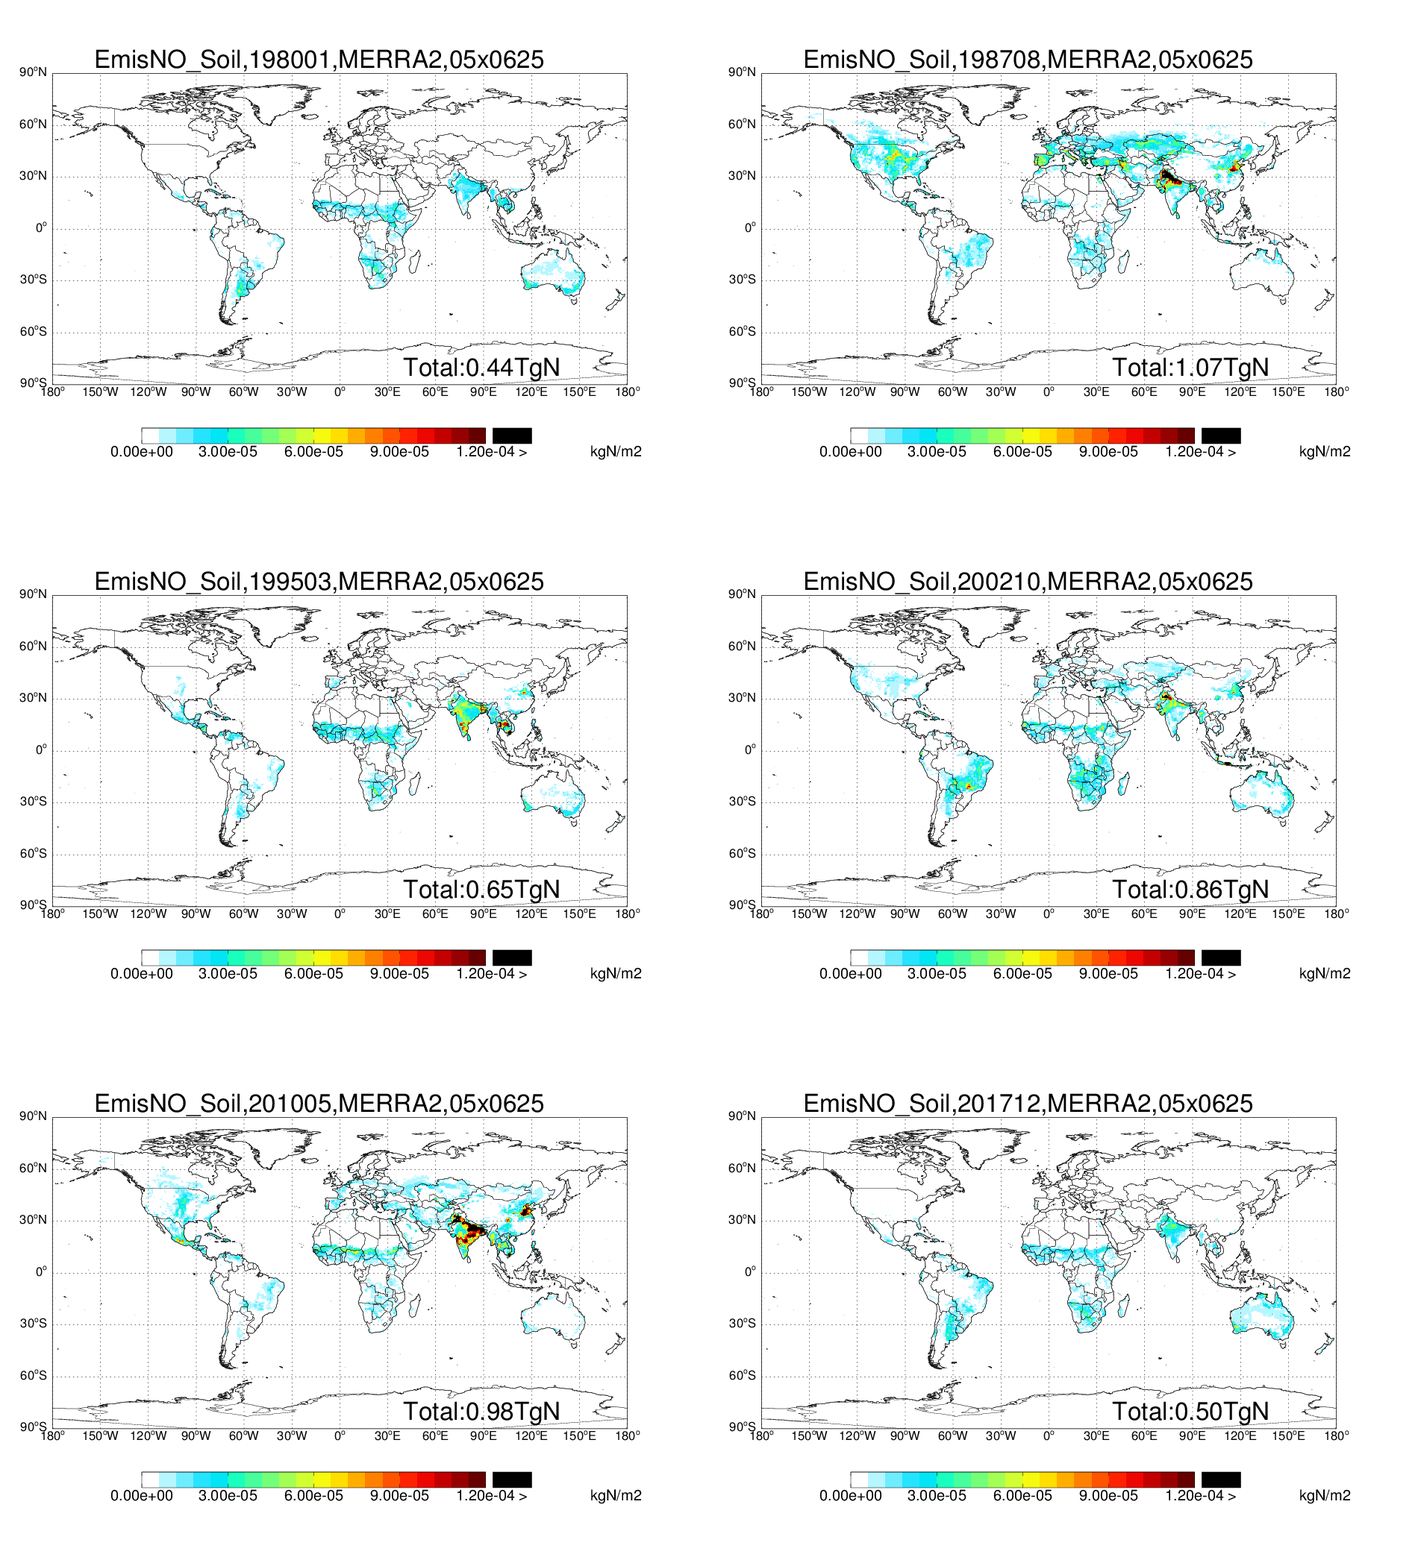
Soil NOx
Spatial distribution of monthly soil NOx emission over 1980—2017 derived based on MERRA-2 at 0.5° lat. × 0.625° lon.

SSAs
Spatial distribution of monthly SSAs emission (sum of SALA and SALC) over 1980—2017 derived based on MERRA-2 at 0.5° lat. × 0.625° lon. Sea salt aerosols emission considers two categories of SSAs based on their radii. The radius of accumulation mode sea salt aerosol (SALA) ranges from 0.01 to 0.5 μm, while that for coarse mode sea salt aerosol (SALC) ranges from 0.5 to 8 μm.

Biogenic VOCs
Spatial distribution of monthly total BOVCs (sum of all species) over 1980—2017 derived based on MERRA-2 at 0.5° lat. × 0.625° lon. Our BVOCs emission includes isoprene (the most abundant species), acetone (ACET), acetaldehyde (ALD2), ethane (C2H4), ethanol (EOH), propene (PRPE), lumped monoterpenes (MTPA), other monoterpenes (MTPO), limonene (LIMO), and sesquiterpenes (SESQ).

Data and Code
References
Weng, H.-J., Lin, J.-T. *, Martin, R., Millet, D. B., Jaeglé, L., Ridley, D., Keller, C., Li, C., Du, M.-X., and Meng, J.: Global high-resolution emissions of soil NOx, sea salt aerosols, and biogenic volatile organic compounds, Scientific Data, 7, 148, doi:10.1038/s41597-020-0488-5, 2020 (PDF) (data download)
Coverage
POMINO-TROPOMI
Temporal Range:
0.5° lat × 0.625° lon
0.25° lat × 0.3125° lon
2° lat × 2.5° lon
4° lat × 5° lon
1980~2017
2014~2017
2014~2017
2014~2017
Spatial Range:
Global


